
SQL
Experienced

Hello, I'm
Data Analyst/Power BI Developer/Software Engineer


Get To Know More


7+ years
Data Analyst/Backend Engineer

B.A. Bachelors Degree
M.A. Masters Degree
Explore My
Experienced
Experienced
Experienced
Experienced
Experienced
Experienced
Intermediate
Intermediate
Experienced
Experienced
Experienced
Experienced
Experienced
Intermediate
Experienced
Experienced
Experienced
Experienced
Intermediate
Intermediate
Experienced
Experienced
Experienced
Experienced
Intermediate
Experienced
Experienced
Experienced
Experienced
Intermediate
Intermediate
Basic
Basic
Basic
Basic
Intermediate
Intermediate
Intermediate
Experienced
Basic
Browse My Recent

Let me walk you through my recent project
Emergency rooms are fast-paced, high-pressure environments where timely decisions can mean the difference between life and death. What if we could predict which patients are at the highest risk of mortality before it's too late? This dashboard reveals insights from advanced predictive analytics that analyzes key factors like patient age, health scores, wait times, and underlying conditions. Explore how data-driven predictions can enhance emergency care, reduce delays, and save lives. Click to uncover the future of ER decision-making!

Emergency rooms are high-pressure environments where quick decisions can save lives. This project leverages predictive analytics to identify high-risk patients based on age, health scores, wait times, and medical conditions. By analyzing historical ER data, the model helps prioritize critical cases, reducing delays and improving survival rates. The interactive dashboard visualizes key patient metrics, mortality trends, and referral patterns for data-driven decision-making. Insights from this analysis enable hospitals to enhance efficiency, optimize resource allocation, and improve patient outcomes. With real-time predictions, healthcare providers can intervene earlier, ultimately saving more lives. This project showcases how advanced analytics can transform emergency care.

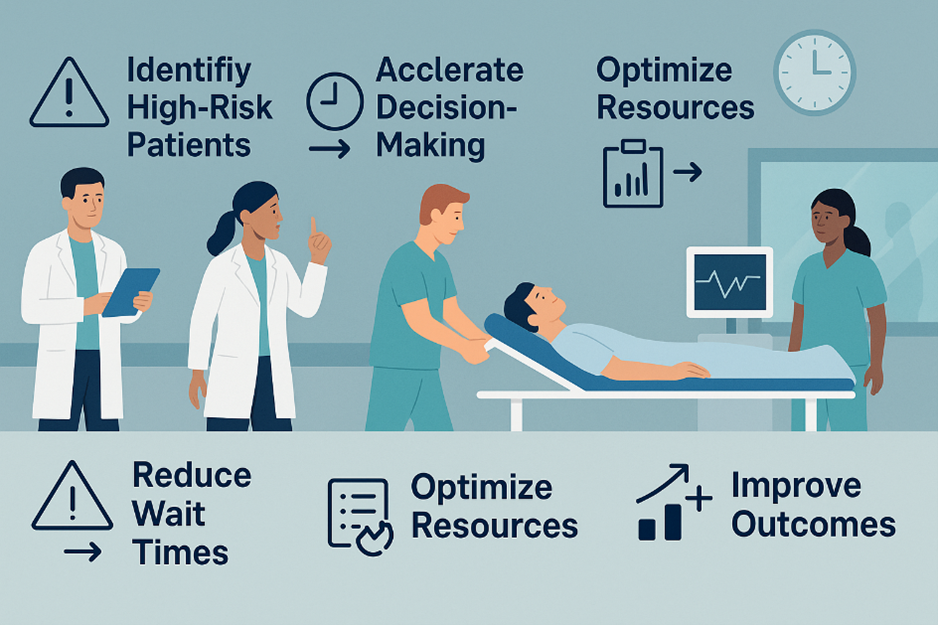
Leverage predictive analytics to identify high-risk ER patients, enabling faster and more accurate decision-making. By analyzing historical patient data, the project aims to reduce wait times and optimize resource allocation. Ultimately, it seeks to improve ER efficiency and patient survival rates through data-driven strategies.
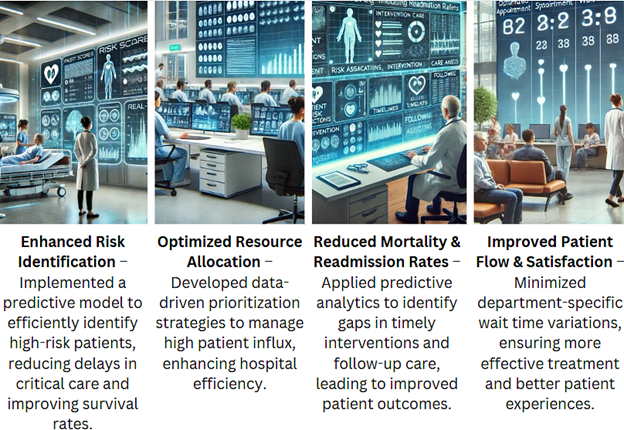
Emergency rooms face significant challenges in identifying high-risk patients efficiently, leading to delays in critical care and increased mortality rates. Limited resources and high patient influx make prioritization difficult, impacting hospital efficiency and survival outcomes. High mortality and readmission rates highlight gaps in timely interventions and follow-up care, while varying wait times across departments affect treatment effectiveness and patient satisfaction. The absence of predictive insights on patient risk factors hinders proactive decision-making and resource allocation. To address these issues, a data-driven approach is essential for analyzing historical ER data, predicting mortality risks, and optimizing emergency care strategies to improve patient outcomes.

The data used for this analysis was sourced from Data.world. The dataset, titled Hospital ER.csv, contains information on patient outcomes—such as whether a patient survived or died—as well as associated health conditions, including infection rates, readmission rates, patient satisfaction, and improvement in health condition. The data spans from 2019 to 2020 and was designed to reflect typical hospital ER operations for use in predictive modeling and performance analysis.
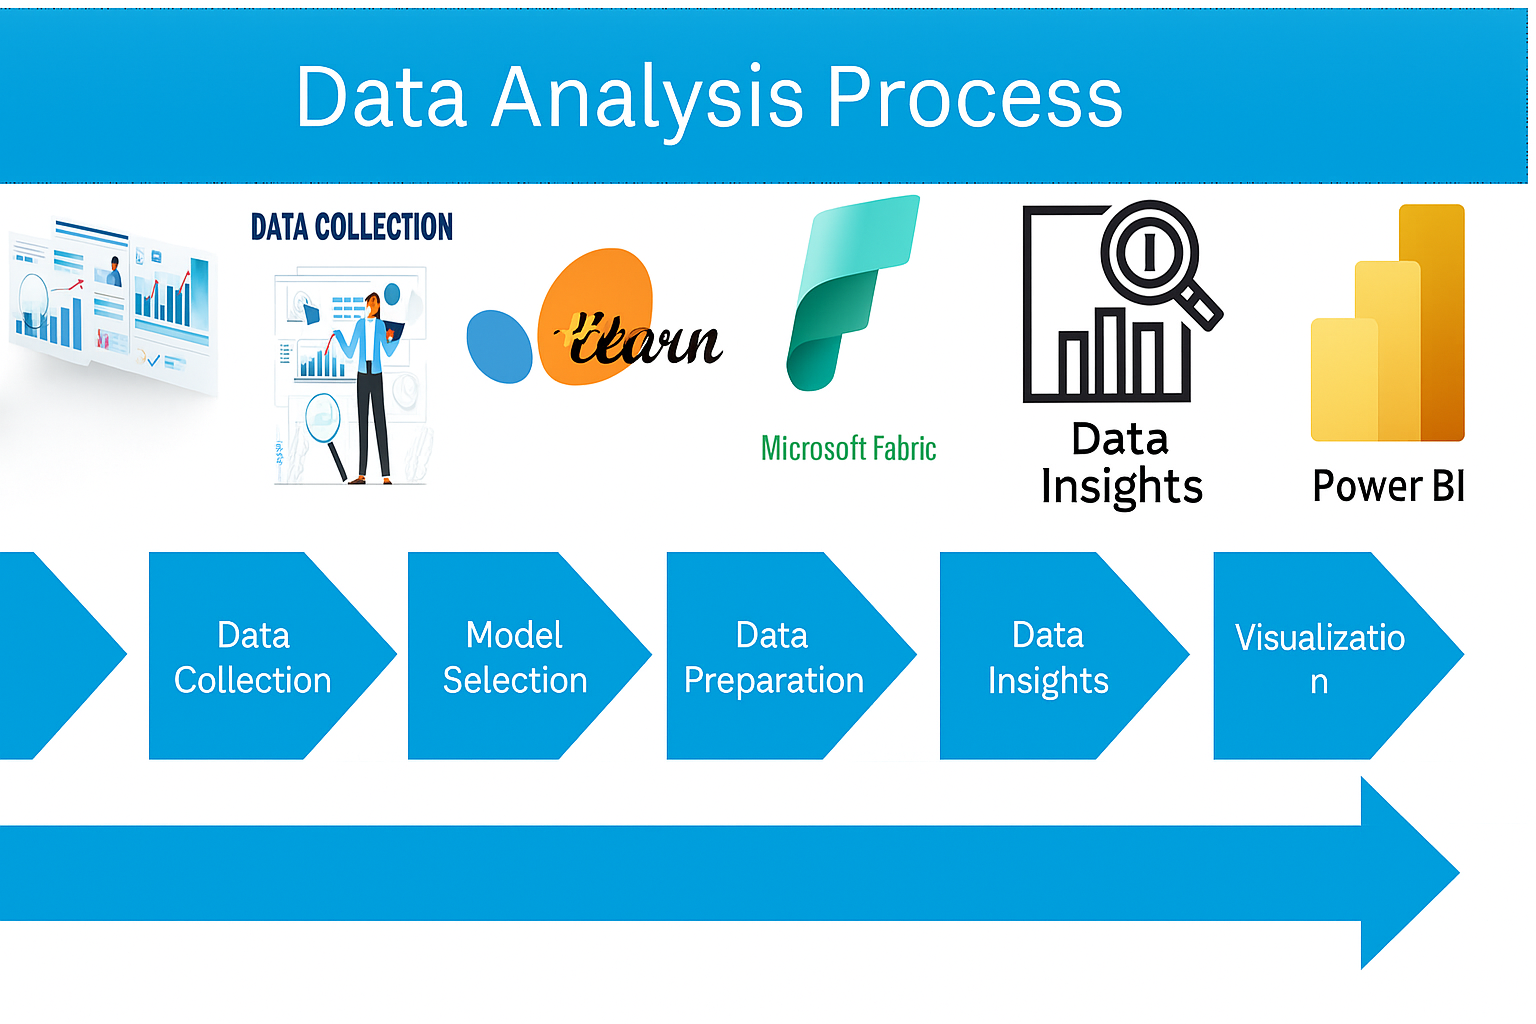
The architecture focuses on improving emergency care by analyzing patient data and predicting mortality risks. It involves gathering historical ER patient records, preprocessing and cleansing the data, selecting key health metrics, applying predictive modeling techniques using Python, and visualizing insights in Power BI. This system enables data-driven decision-making to enhance patient outcomes and optimize emergency response strategies.
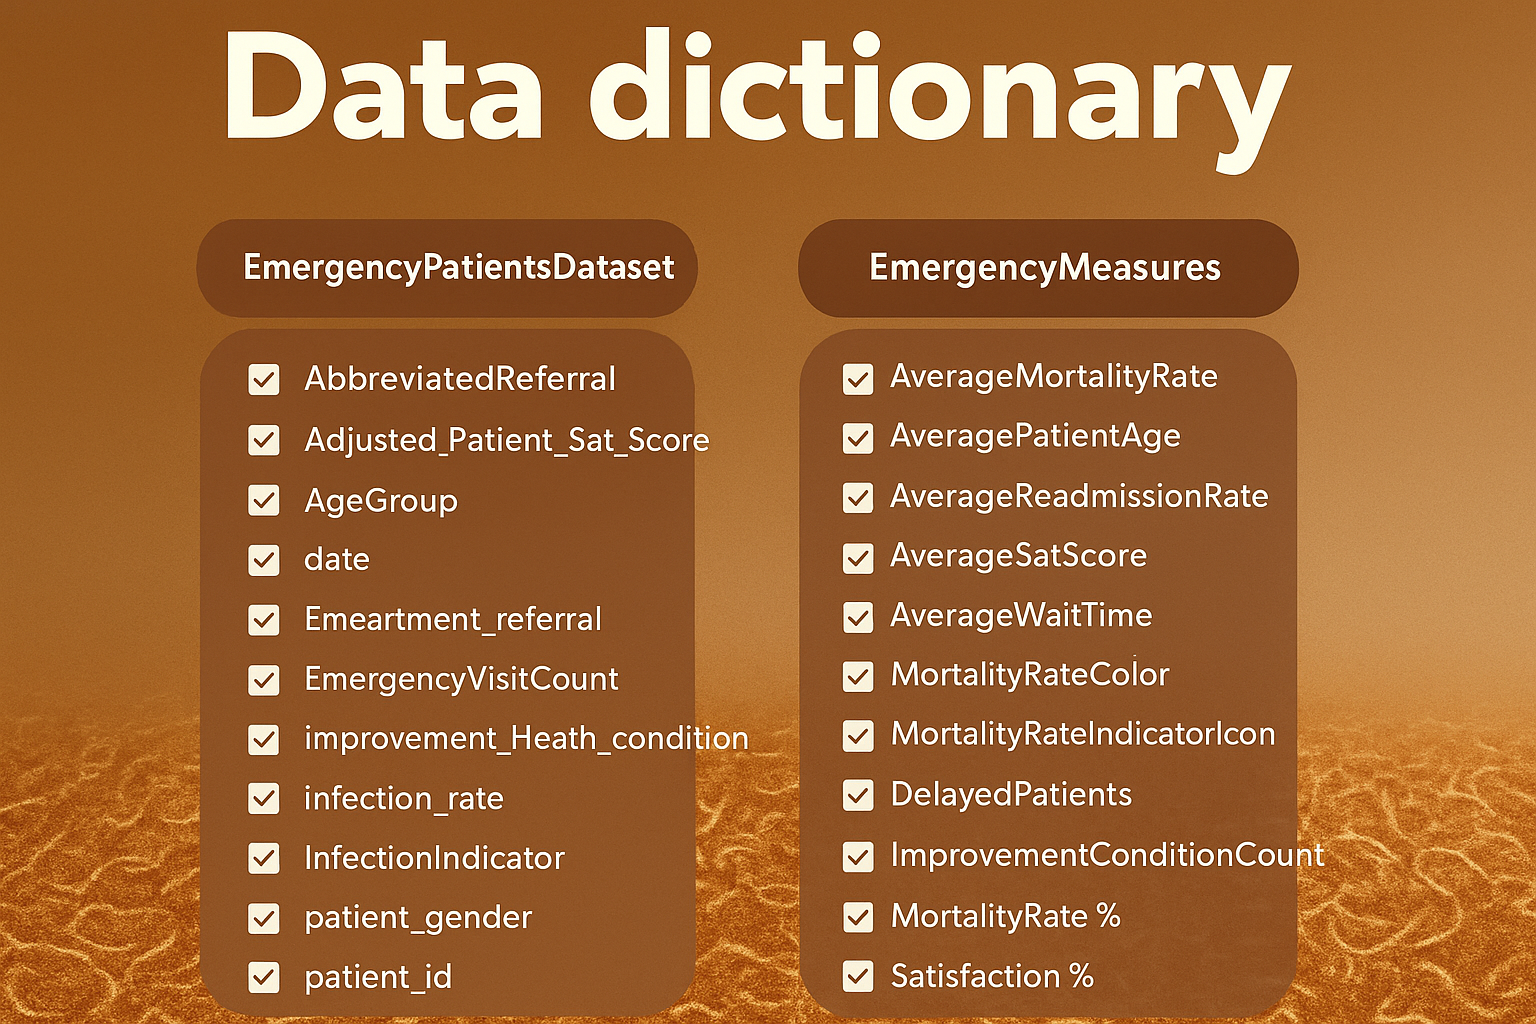
The dataset includes variables such as mortality rate, patient gender, age, satisfaction score, wait time, department referral, infection rate, and readmission rate, which are critical for predicting ER patient outcomes, improving emergency response strategies, and optimizing healthcare resource allocation across different departments and timeframes.
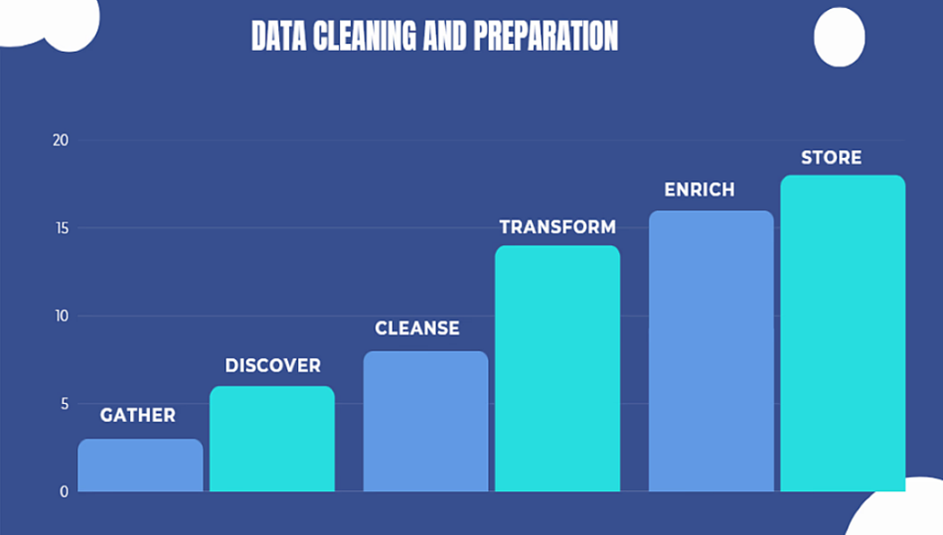
The data was cleaned by identifying and removing duplicates, handling missing values, filtering outliers, and standardizing the dataset to ensure consistency and reliability. These steps were crucial in preparing the data for analyzing mortality rates, patient demographics, wait times, infection rates, and readmission risks, ultimately supporting accurate predictions and insights into ER patient outcomes.
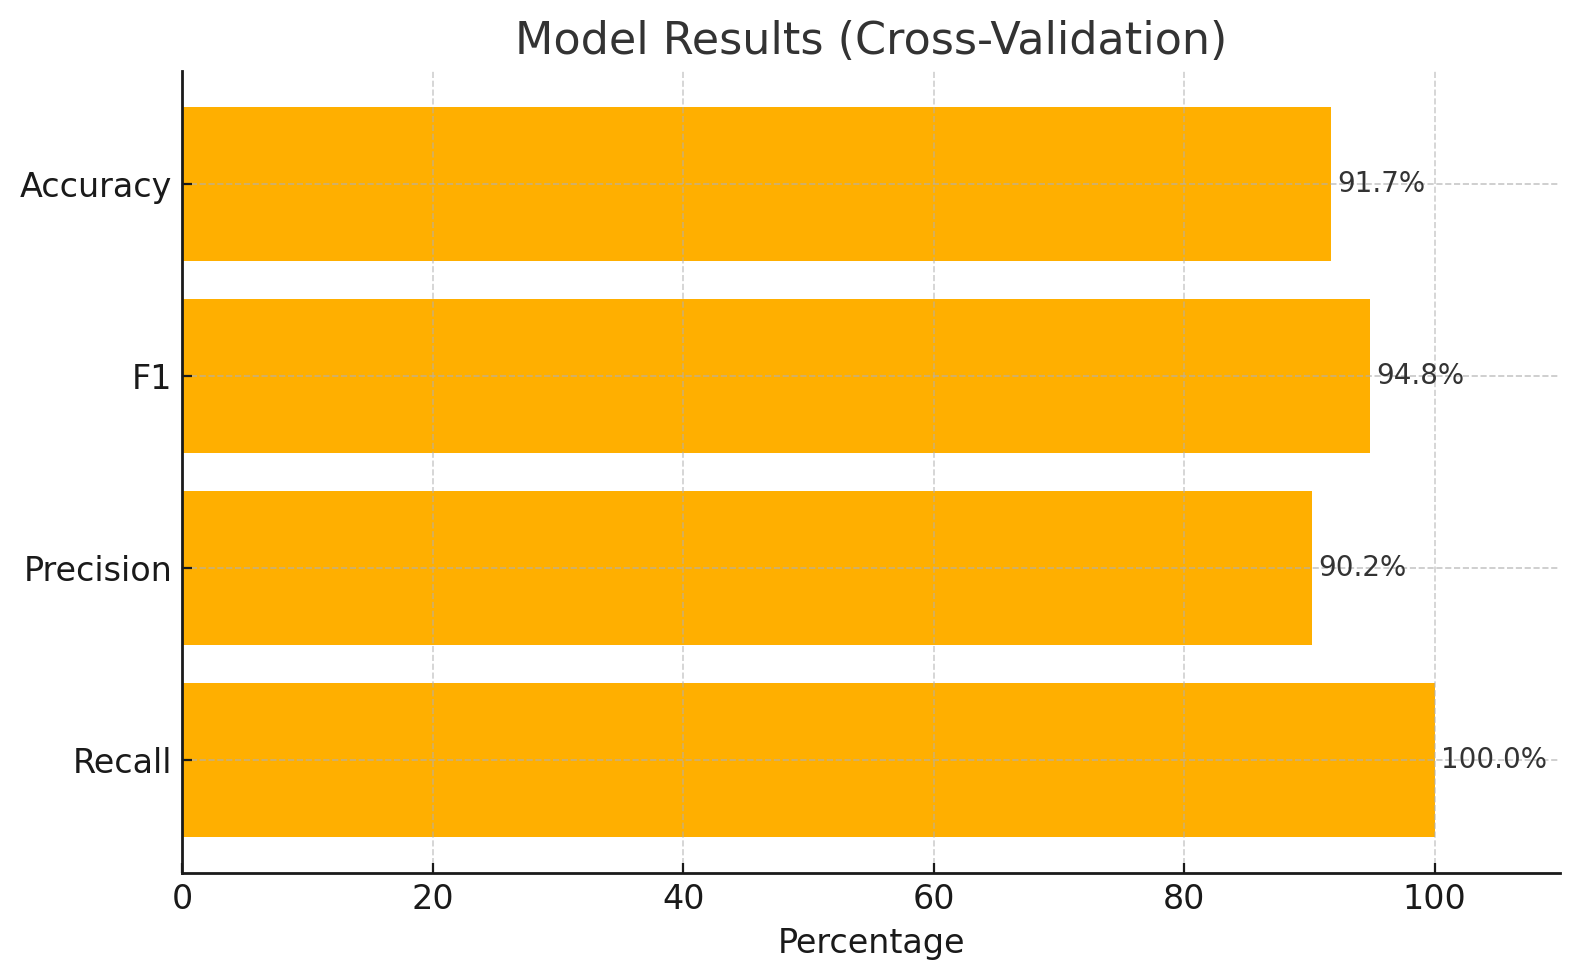
The ExtraTreeClassifier was selected for its effectiveness in predicting ER patient mortality using both numerical and categorical health indicators. This model demonstrated strong performance in terms of accuracy, precision, recall, and F1 score, effectively capturing patterns related to mortality rates, patient demographics, wait times, infection rates, and readmission risks. Its ability to handle complex interactions between variables makes it well-suited for healthcare predictive analytics.
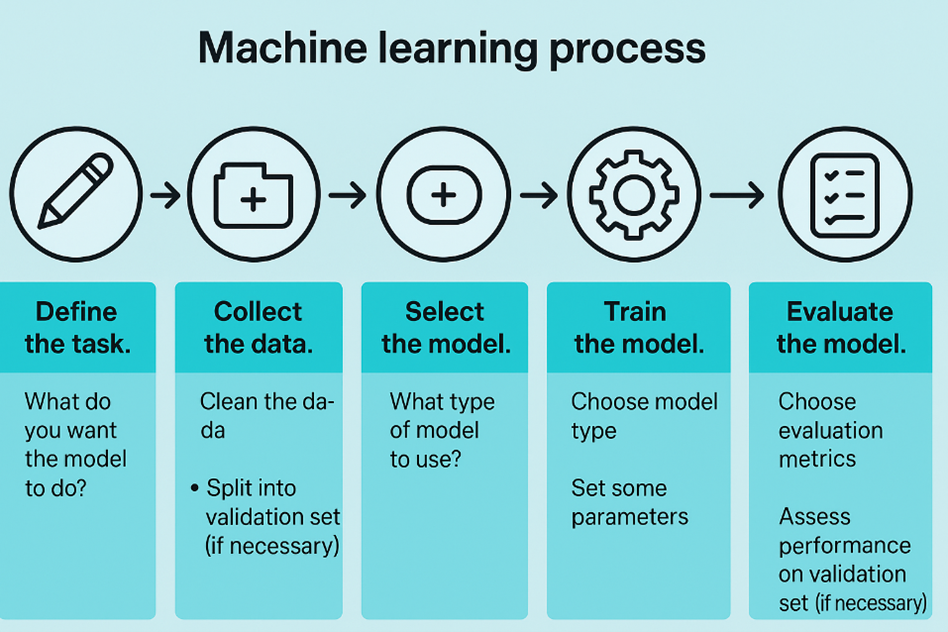
The ExtraTreeClassifier was trained on historical ER patient data using a training-testing split. The training set allowed the model to identify key patterns in mortality rates, patient demographics, wait times, infection rates, and readmission risks, while the testing set ensured reliable predictions on unseen data. This approach helped maintain accuracy, generalization, and robustness in predicting ER patient outcomes.
.png)
The ExtraTreesClassifier model shows strong performance in predicting ER patient mortality. It achieved 91.7% accuracy and an F1 score of 94.8%, indicating a good balance between precision and recall. The recall is 100%, meaning it successfully identified all actual high-risk (mortality) cases. With a precision of 90.2%, the model also minimizes false positives, making it reliable for critical care decisions.
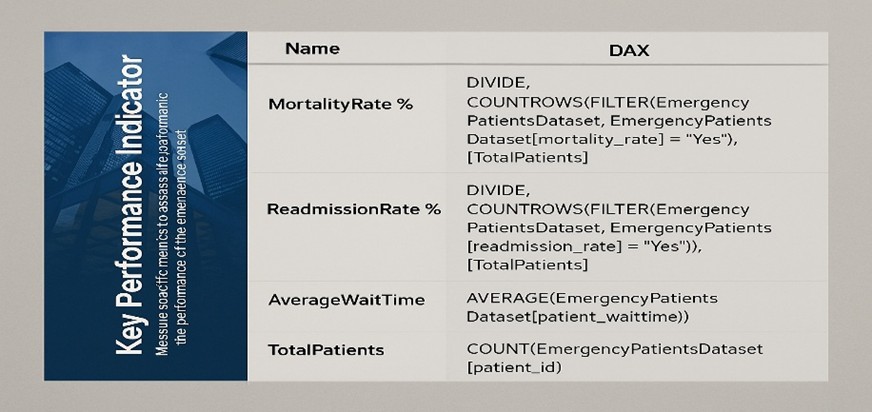
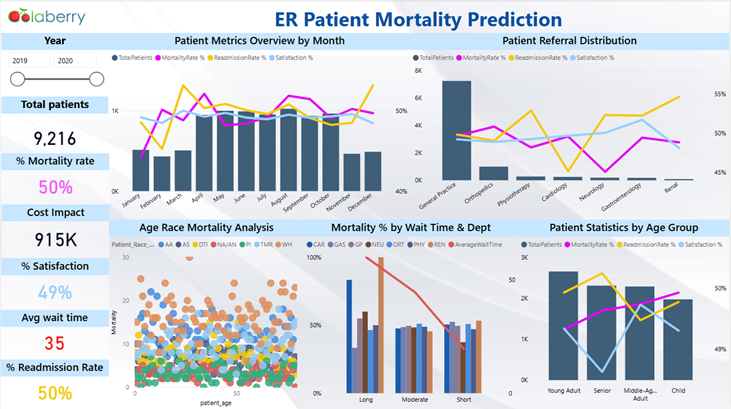
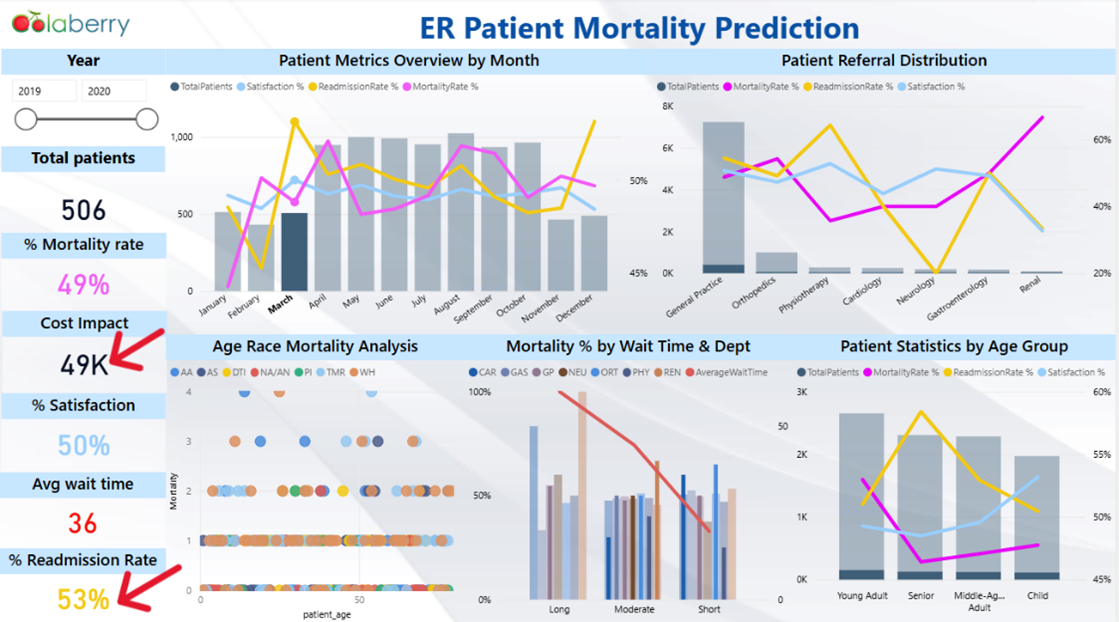
The Power BI dashboard analyzes ER patient mortality trends from 2019 to 2020, highlighting key metrics such as mortality rate, patient demographics, wait times, infection rates, and readmission risks. Visualizations track patterns in patient outcomes, showing variations across different departments, age groups, and referral sources. The dashboard also emphasizes relationships between key health indicators and mortality risks, providing actionable insights to support emergency response optimization, resource allocation, and improved patient care strategies.
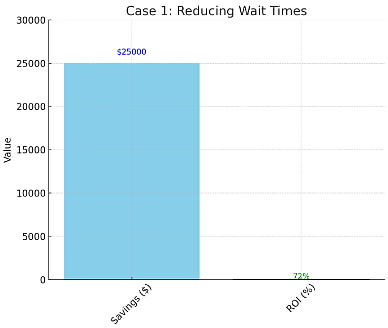
Visualization - Case 1 Objective: Reduce wait times in high-mortality departments like Cardiology
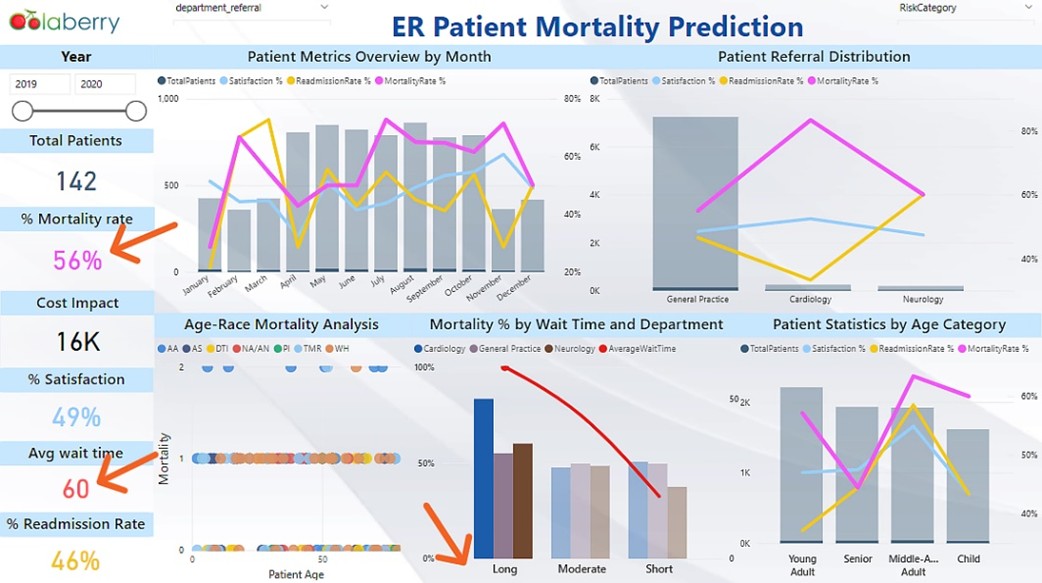
Reducing wait times in high-mortality departments like Cardiology can significantly improve patient outcomes. Patients seen within 19 minutes have a 49% mortality rate, while those experiencing 60-minute wait times face a 56% mortality rate, highlighting the life-saving impact of timely care.
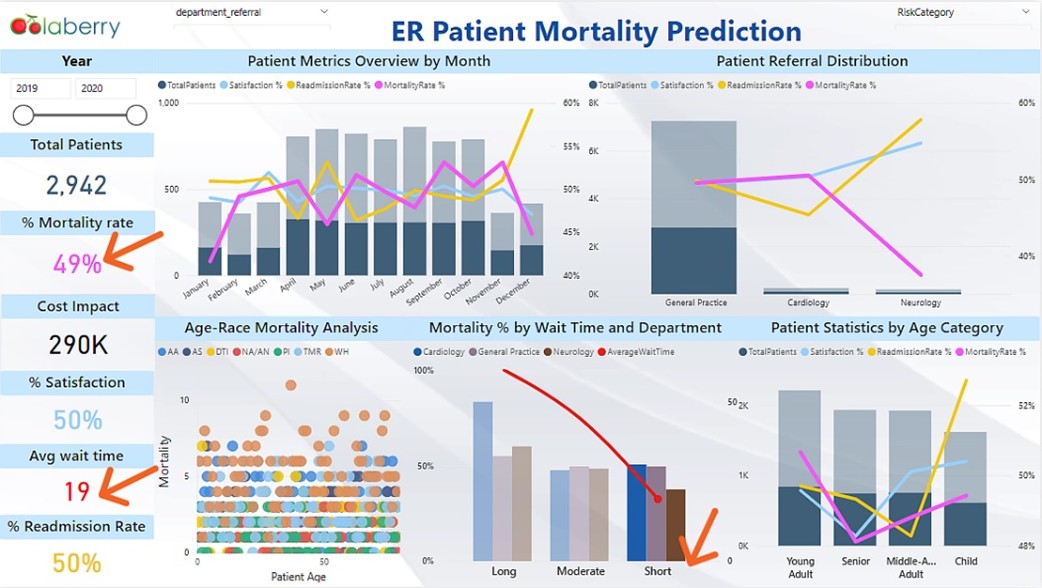
Delays in high-mortality departments like Cardiology contribute to preventable deaths, with extended wait times (60 minutes) leading to higher mortality rates (56%), negatively impacting patient outcomes each year.
ROI: Reducing wait times with a $34,700 investment could save $25,000 annually, yielding a 72% ROI while improving patient outcomes and reducing complications.
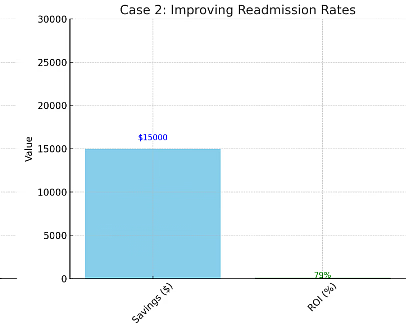
Visualizations - Case 2 Objective: Improve readmission rates
A reduced readmission rate of 45% has directly contributed to lowering the cost impact to 43K, highlighting more effective care and resource utilization
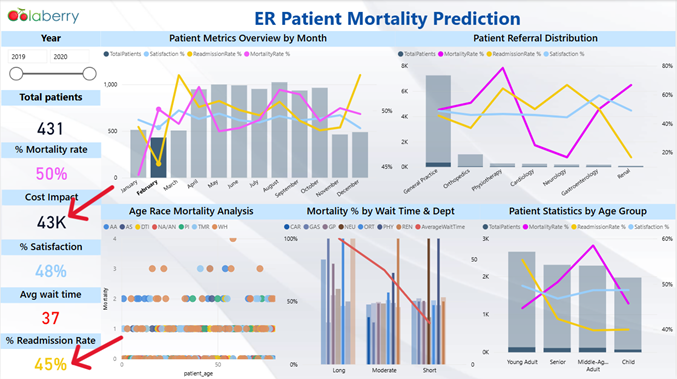
High readmission rates increase operational costs due to recurring patient visits. The increase in readmission rate to 53% has directly contributed to a higher cost impact of 49K, highlighting the financial burden associated with frequent patient returns.
ROI: Improving readmission rates with a $19,000 investment could save $15,000 annually, yielding a 79% ROI while enhancing post-care processes and reducing hospital strain.
Reducing Wait Times – Shortening patient wait times led to improved treatment efficiency, enhancing patient outcomes. Faster care delivery reduced complications and optimized resource utilization.
Enhancing Readmission Rates – Implementing strategies to lower readmissions improved patient recovery and decreased hospital strain, resulting in better long-term healthcare efficiency.
Optimizing Resource Allocation – Addressing inefficiencies in patient flow improved hospital capacity management, leading to better patient care and operational performance.

Reducing Wait Times led to $25,000 in savings and a 72% ROI, improving patient flow and reducing complications.Enhancing Readmission Rates saved $15,000 with a 79% ROI, reducing hospital strain and improving post-care outcomes.Optimizing Resource Allocation improved hospital efficiency, ensuring better patient care and operational performance.
Implementing Targeted Care Strategies improved treatment effectiveness, leading to better patient satisfaction and long-term healthcare benefits. Enhancing Healthcare Management through data-driven insights ensures continuous improvement in patient outcomes and financial sustainability.

The model effectively identified key factors influencing ER patient mortality, enabling early detection of high-risk cases and more targeted intervention. Improvements in patient satisfaction and reduced wait times contributed to lower readmissions and overall cost impact, supporting more efficient emergency care delivery. Data-driven insights from the dashboard empowered clinical teams to optimize resource allocation and enhance patient outcomes.
Working with Missing Data – Handling incomplete patient records posed challenges in ensuring model accuracy. The solution involved imputing missing values, removing inconsistencies, and applying robust data preprocessing techniques to maintain reliable predictions.
Optimizing Patient Flow – Managing high patient volumes in emergency departments created delays in critical care delivery. Future improvements include leveraging predictive analytics for triage optimization, streamlining admission processes, and enhancing real-time monitoring to improve patient outcomes and hospital efficiency.

Model Optimization – The ExtraTreeClassifier was refined by removing less impactful features, reducing complexity and improving computational efficiency. Fine-tuning hyperparameters enhanced model performance while optimizing memory usage and inference speed.
Data Quality – Comprehensive data cleaning and validation ensured accuracy and reliability, which was essential for generating meaningful insights into patient mortality, readmission rates, and wait time impacts on outcomes.
Insight Development – Despite challenges with limited patient data granularity, advanced analytical techniques enabled valuable insights. This highlighted the need for more detailed health records to enhance predictive accuracy and clinical decision-making.
Data Constraints – While a constrained dataset limited the scope of predictions, the process demonstrated opportunities to expand data collection efforts, incorporating more patient attributes and real-time monitoring data for deeper, more precise analyses.

Wait Time Impact
Observation: Patients experiencing extended wait times had higher mortality rates, particularly in high-risk departments.
Recommendation: Implement triage optimization strategies, predictive analytics for patient prioritization, and streamlined admission processes to reduce wait times and improve patient outcomes.
Readmission Challenges
Observation: High readmission rates placed a strain on hospital resources and impacted patient recovery.
Recommendation: Strengthen post-discharge follow-up programs, patient education, and predictive monitoring to reduce unnecessary readmissions and enhance long-term care effectiveness.
Mortality Rate Disparities
Observation: Some departments had significantly higher mortality rates compared to others.
Recommendation: Conduct a root cause analysis to identify contributing factors, improve intervention protocols, and allocate resources effectively to high-risk areas for better patient survival rates.
Data Completeness & Quality
Observation: Missing or incomplete patient records impacted the accuracy of predictive models.
Recommendation: Standardize data collection, improve record-keeping practices, and integrate additional patient health indicators to strengthen model reliability and enhance decision-making.
Resource Utilization Optimization
Observation: Hospital capacity issues and inefficient patient flow contributed to delays in critical care.
Recommendation: Leverage predictive analytics for resource allocation, optimize emergency response workflows, and introduce data driven forecasting to enhance hospital efficiency.

Get in Touch